
db2diag.log is the main diagnostic log for a Db2 instance and, together with the notification log, is one of the first places to look when there are connection failures, lock issues, deadlocks, or unexpected engine behavior. The long-standing problem has been access: free text, many output styles, positional fields, and fragile parsing when you want to automate analysis.
Db2 12.1.3.0 introduced the -json option in db2diag. When enabled, the command output becomes JSON Lines: one JSON object per line, with structured fields that can be filtered and aggregated with jq. The goal of this article is to show what can be done with that JSON format. Lock timeouts and deadlocks are only the practical example used to make the difference between free text and structured data visible.
1. Objectives and lab introduction
By the end of this lab you should be able to:
- understand what kind of analysis becomes easier with
db2diag -json - identify the parameters that control diagnostic and lock-event logging
- understand the traditional
db2diagapproach and its limitations - use
db2diag -jsonto inspect the fields available in a concrete message - transform JSON output into readable tables with
jqandcolumn - create a reusable template to repeat the analysis later
The point is to show why JSON output improves triage, correlation, and automation when Db2 starts producing diagnostic events that are hard to read manually.
2. What you need to run the lab
You will need:
- Db2 LUW 12.1.3.0 or later
- A Linux system. Pay attention to minimum supported versions. For Red Hat use 9.4 or later; for Ubuntu use 22.04.5 or later.
- Access to the Db2 instance owner account
jqcolumnawk,grep,sed,bash, and standard shell utilities
If Db2 is not already installed, get it from the IBM software download portal or from the distribution mechanism tied to your license or entitlement. Db2 Community Edition is sufficient.
If needed, install Db2 and create the instance you will use in the lab.
To install the helper software, run:
On RHEL, Rocky, AlmaLinux, SLES
sudo dnf install -y jq util-linuxOn Debian or Debian-based distributions
sudo apt-get install -y jq util-linuxThe commands below must be run as the Db2 instance owner.
The parameters we will change are:
| Parameter | Level | Purpose |
|---|---|---|
| DIAGLEVEL | DBM CFG | Controls which severities are written to db2diag.log |
| NOTIFYLEVEL | DBM CFG | Controls which events are written to the notification log |
| LOCKTIMEOUT | DB CFG | Defines how long a lock wait can last |
| DLCHKTIME | DB CFG | Defines the deadlock detection interval in milliseconds |
| MON_LCK_MSG_LVL | DB CFG | Controls logging of deadlocks, lock timeouts, and lock waits |
For this lab:
| Value | Effect |
|---|---|
| DIAGLEVEL 3 | Ensures Warning, Error, and Severe events are logged |
| NOTIFYLEVEL 3 | Keeps the notification log useful for normal operations |
| LOCKTIMEOUT 5 | Forces a quick lock timeout |
| DLCHKTIME 1000 | Makes deadlock detection happen before a 5-second timeout can win |
| MON_LCK_MSG_LVL 3 | Logs deadlocks, lock timeouts, and lock waits in db2diag.log |
3. Traditional diagnostic viewing mechanisms
db2diag
The db2diag command is still the central tool for reading db2diag.log. It lets you filter by severity and time interval and other criteria, offers basic formatting and search options, and is useful when you are investigating an incident in real time.
Example:
db2diag -t "$(date -d '1 hour ago' '+%Y-%m-%d-%H.%M.%S')" -l Warning,Error,SevereThere are, however, some limitations:
- It is hard to aggregate by
pid,tid, component, or function without extra parsing - Messages with nested fields require regex or other fragile parsing techniques
grepworks line by line and, even if you ask for adjacent lines, it does not understand the full context of a diagnostic block- Exporting to CSV or correlating events takes more work than it should
Administrative views
Administrative views such as SYSIBMADM.PDLOGMSGS_LAST24HOURS are useful for operational monitoring. They provide SQL flexibility, but they read the notification log rather than db2diag.log. They are good for startup, shutdown, and general operational events.
Example:
db2 connect to DIAGJSON
db2 "SELECT TIMESTAMP, MSGSEVERITY, SUBSTR(MSG,1,256) AS MSG FROM SYSIBMADM.PDLOGMSGS_LAST24HOURS ORDER BY TIMESTAMP DESC FETCH FIRST 20 ROWS ONLY"
Main limitations:
- They depend on Db2 being operational
- They do not show every internal diagnostic detail
Table functions and SQL monitoring
Table functions and monitoring views help with dashboards and continuous observability, but they also depend on a healthy Db2 instance. They are very useful when the instance and database are up, but far less useful when they are not, and that is exactly when diagnostic information matters most.
In short:
db2diagis the closest source to the actual event- SQL views and functions are good for observability when the system is healthy
4. JSON output support in Db2 (db2diag -json)
Starting with Db2 12.1.3.0, you can add -json to db2diag.
That changes two things:
- the output becomes JSON Lines, with one JSON object per line
- fields become structured and can be consumed without parsing free text
The advantages are clear:
- the data is delivered in a structured format that observability platforms can consume more easily
- tools that process JSON, such as
jq, can explore the data flexibly
For the type of analysis covered in this article, JSON does not replace classic db2diag; it complements it. Use the traditional format for quick inspection and JSON when you need more flexible filtering, parsing, and formatting.
5. Lab scenario and execution
We will create a database, schema objects, and sample data, then generate several lock timeouts and one deadlock scenario to produce contention-related records in db2diag.log. We will use the new JSON formatting capability to inspect the resulting diagnostic information.
Establish the required database and instance configuration
Start by creating the database and setting the required Db2 instance and database parameters.
db2 create database DIAGJSON
db2 connect to DIAGJSON
db2 "UPDATE DB CFG FOR DIAGJSON USING LOCKTIMEOUT 5 MON_LCK_MSG_LVL 3"
db2 update dbm cfg using DIAGLEVEL 3 NOTIFYLEVEL 3
db2stop force
db2start
To confirm the values, run:
db2 get dbm cfg | grep -iE "diaglevel|notifylevel"
db2 get db cfg for DIAGJSON | grep -iE "locktimeout|mon_lck_msg_lvl"
Create the schema objects and load the sample data:
db2 connect to DIAGJSON
db2 "CREATE SCHEMA app"
db2 "CREATE TABLE app.accounts (id INTEGER NOT NULL, balance DECIMAL(10,2), PRIMARY KEY (id))"
db2 "INSERT INTO app.accounts VALUES (1, 5000.00)"
db2 "INSERT INTO app.accounts VALUES (2, 3000.00)"
db2 commit
db2 connect reset
Generate the problem and the diagnostic evidence
Generate a lock timeout. We start two sessions. One session holds a lock and the other session tries to access the locked row until the timeout occurs.
cat > /tmp/hold_lock.sh <<'EOF'
#!/bin/bash
db2 connect to DIAGJSON
db2 +c "UPDATE app.accounts SET balance = balance - 100 WHERE id = 1"
sleep 30
db2 commit
db2 connect reset
EOF
chmod +x /tmp/hold_lock.sh

bash /tmp/hold_lock.sh &
LOCK_PID=$!
sleep 3

db2 connect to DIAGJSON
db2 "UPDATE app.accounts SET balance = balance + 100 WHERE id = 1"
kill $LOCK_PID 2>/dev/null
wait $LOCK_PID 2>/dev/null
db2 connect reset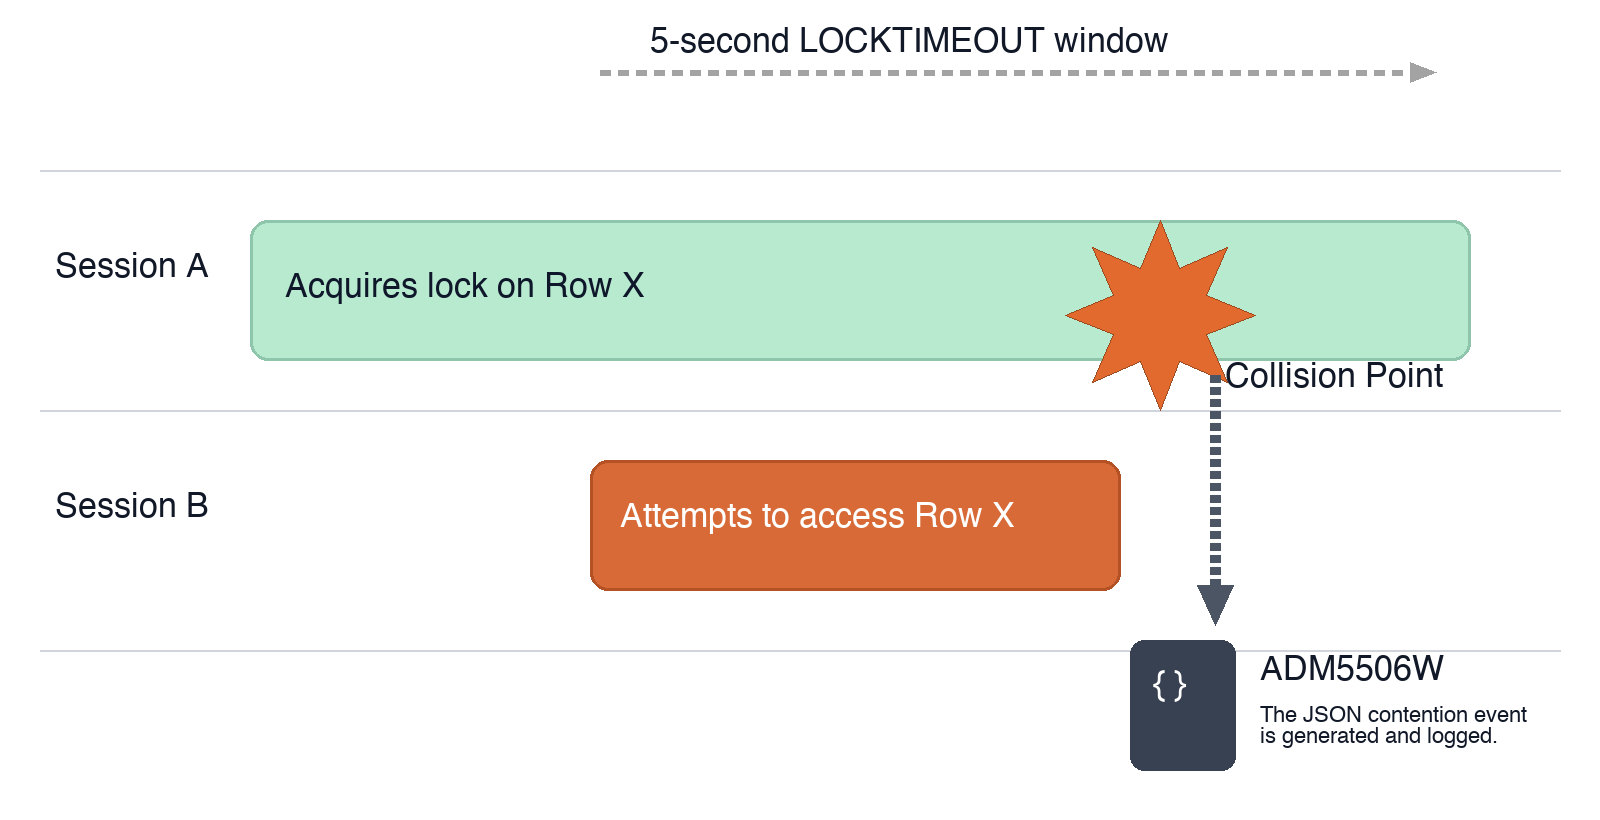
Now generate a deadlock. We will use two sessions that update rows from the same table in opposite order. Neither session can acquire the second lock because the other session already holds the needed row.
For this test, we disable the per-session timeout with CURRENT LOCK TIMEOUT = -1 and reduce DLCHKTIME to 1000, so deadlock detection can happen before the scenario degrades into a timeout.
db2 connect to DIAGJSON
db2 "UPDATE DB CFG FOR DIAGJSON USING DLCHKTIME 1000"
db2 connect reset

cat > /tmp/deadlock_a.sh <<'EOF'
#!/bin/bash
db2 connect to DIAGJSON
db2 "SET CURRENT LOCK TIMEOUT -1"
db2 +c "UPDATE app.accounts SET balance = balance - 100 WHERE id = 1"
sleep 2
db2 +c "UPDATE app.accounts SET balance = balance + 100 WHERE id = 2"
db2 rollback
db2 connect reset
EOF

cat > /tmp/deadlock_b.sh <<'EOF'
#!/bin/bash
db2 connect to DIAGJSON
db2 "SET CURRENT LOCK TIMEOUT -1"
db2 +c "UPDATE app.accounts SET balance = balance - 100 WHERE id = 2"
sleep 2
db2 +c "UPDATE app.accounts SET balance = balance + 100 WHERE id = 1"
db2 rollback
db2 connect reset
EOF

chmod +x /tmp/deadlock_a.sh /tmp/deadlock_b.sh
bash /tmp/deadlock_a.sh &
bash /tmp/deadlock_b.sh &
wait
After the test, restore the default deadlock detection interval if you want to go back to normal behavior:
db2 connect to DIAGJSON
db2 "UPDATE DB CFG FOR DIAGJSON USING DLCHKTIME 10000"
db2 connect reset
Now we can move to JSON formatting. db2diag JSON output produces one independent JSON object per line.
If the per-session timeout remains below the deadlock detection interval, Db2 can return SQL0911N with reason code 68 and log only the contention as ADM5506W. That is why the deadlock scenario below adjusts both CURRENT LOCK TIMEOUT and DLCHKTIME before repeating the test.
The JSON schema file that defines the expected structure is located at ~/sqllib/misc/db2diag.schema.json:
Inspect it directly:
sed -n '1,80p' ~/sqllib/misc/db2diag.schema.jsonWe now have a picture of the schema before looking at actual db2diag output.
Inspect a concrete lock-timeout message and compare it with the schema:
db2diag -level Warning -g msg:=ADM5506W -json -V > /tmp/adm5506w.jsonl
head -1 /tmp/adm5506w.jsonl
Use jq pretty print for the same output:
db2diag -level Warning -g msg:=ADM5506W -json -V | head -1 | jq '.'List the top-level field names available in the first entry that matches ADM5506W:
db2diag -level Warning -g msg:=ADM5506W -json -V |
jq -nr 'first(inputs) | keys_unsorted[]'
This is useful when you want to discover the available fields quickly without visually parsing the full text of a message.
Now we will make the example more practical. We filter with db2diag parameters and then use jq and column to produce a clean table in the terminal. column is used to render aligned rows in the terminal. If you are writing the output to a file, you can omit column.
The example extracts structured fields from the JSON and also parses parts of the textual message. That is much more stable than trying to do the same thing with grep over db2diag output.
db2diag -level Warning -g msg:=ADM5506W -json -V |
jq -nr '
  def msg: (.message // "" | gsub("[\n ]+"; " "));
  def cap($re): (msg | capture($re).v? // "-");

  ["timestamp","timezone","level","pid","tid","process","instance","member","database","apphdl","appid","uowid","actid","authid","hostname","eduid","eduname","function","probe","event_type","lock_id","event_ts","affected_app","workload","affected_appid","role"],

  (
    inputs
    | [
        (.timestamp // "-"),
        (.timezone // "-"),
        (.level // "-"),
        (.pid // "-"),
        (.tid // "-"),
        (.process // "-"),
        (.instance // "-"),
        (.member // "-"),
        (.database // "-"),
        (.apphdl // "-"),
        (.appid // "-"),
        (.uowid // "-"),
        (.actid // "-"),
        (.authid // "-"),
        (.hostname // "-"),
        (.eduid // "-"),
        (.eduname // "-"),
        (.function // "-"),
        (.probe // "-"),
        cap("type of the event is: \"(?<v>[^\"]+)\""),
        cap("identifier of the lock on which this event happened is: \"(?<v>[^\"]+)\""),
        cap("timestamp of the event is: \"(?<v>[^\"]+)\""),
        cap("affected application is named \"(?<v>[^\"]+)\""),
        cap("workload named \"(?<v>[^\"]+)\""),
        cap("application identifier is: \"(?<v>[^\"]+)\""),
        cap("role that this application plays with respect to this lock is: \"(?<v>[^\"]+)\"")
      ]
  )
  | @tsv
' |
column -t -s $'\t'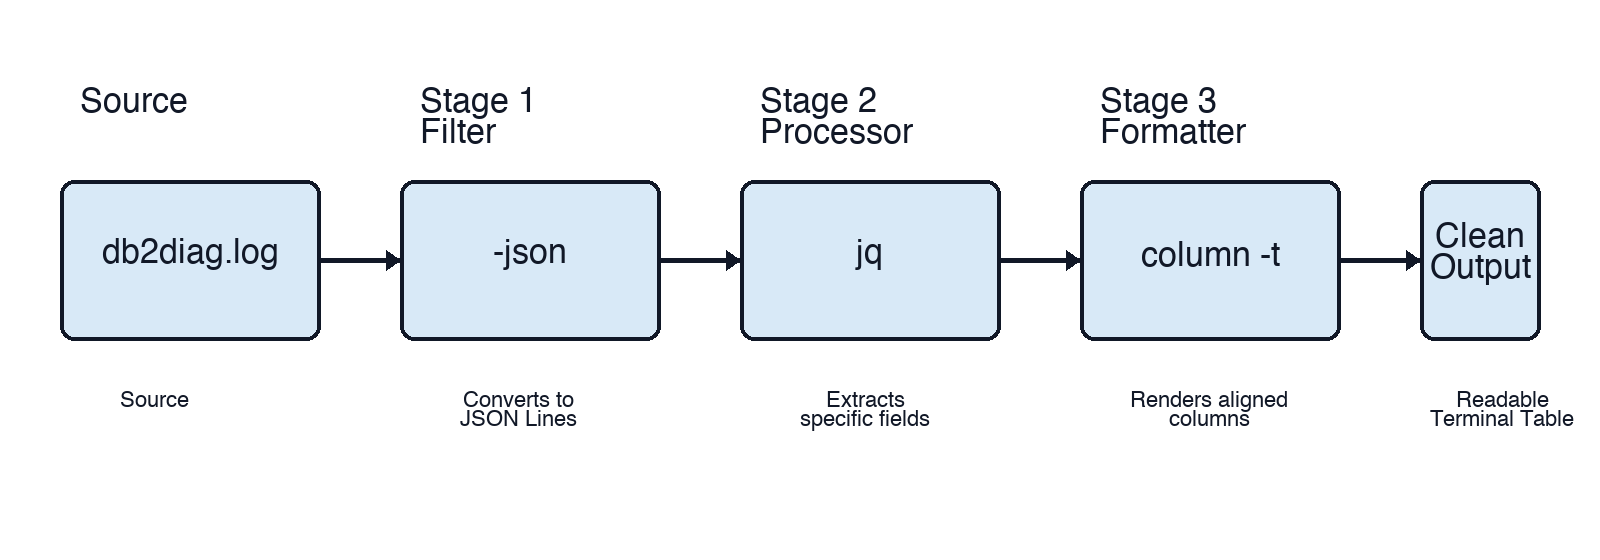
When you repeat the analysis more than once, it is worth saving the specification in a file and reusing it from jq. Create the definition file:
mkdir -p ~/db2diag-jq
vi ~/db2diag-jq/adm5506w-locks.jq
Paste the following content into the file:
def msg: (.message // "" | gsub("[\n ]+"; " "));
def cap($re): (msg | capture($re).v? // "-");

["timestamp","timezone","level","pid","tid","process","instance","member","database","apphdl","appid","uowid","actid","authid","hostname","eduid","eduname","function","probe","event_type","lock_id","event_ts","affected_app","workload","affected_appid","role"],

(
  inputs
  | [
      (.timestamp // "-"),
      (.timezone // "-"),
      (.level // "-"),
      (.pid // "-"),
      (.tid // "-"),
      (.process // "-"),
      (.instance // "-"),
      (.member // "-"),
      (.database // "-"),
      (.apphdl // "-"),
      (.appid // "-"),
      (.uowid // "-"),
      (.actid // "-"),
      (.authid // "-"),
      (.hostname // "-"),
      (.eduid // "-"),
      (.eduname // "-"),
      (.function // "-"),
      (.probe // "-"),
      cap("type of the event is: \"(?<v>[^\"]+)\""),
      cap("identifier of the lock on which this event happened is: \"(?<v>[^\"]+)\""),
      cap("timestamp of the event is: \"(?<v>[^\"]+)\""),
      cap("affected application is named \"(?<v>[^\"]+)\""),
      cap("workload named \"(?<v>[^\"]+)\""),
      cap("application identifier is: \"(?<v>[^\"]+)\""),
      cap("role that this application plays with respect to this lock is: \"(?<v>[^\"]+)\"")
    ]
)
| @tsv
Repeat the previous example, this time using the template file instead of putting every parameter on the command line:
db2diag -level Warning -g msg:=ADM5506W -json -V |
jq -nr -f ~/db2diag-jq/adm5506w-locks.jq |
column -t -s $'\t'
6. Final considerations and summary
Traditional db2diag output is good for quick inspection, but it has limitations. With db2diag -json, each event becomes a structured object, which makes it easier to:
- count events by component
- group by
pidortid - export to TSV or CSV
- integrate with automation and observability systems
7. Cleanup
After finishing the lab, run:
db2 connect reset
db2 drop database DIAGJSON
Remove the temporary files too:
rm -f /tmp/hold_lock.sh /tmp/deadlock_a.sh /tmp/deadlock_b.sh
rm -f ~/db2diag-jq/adm5506w-locks.jq
Useful IBM documentation
For deeper reading, the most useful IBM references for this topic are: